While at PANSOC, postdoc Maria Bekker-Nielsen Dunbar co-authored a new preprint systematically reviewing the prevalance of Aedes-borne (mosquito-carried) Arboviral infections in Europe in recent decades.
The authors carried out a registered systematic review of studies that discuss the spread of various diseases transmitted to humans by Aedes mosquitoes in Europe from 2000 to 2023. These diseases, including dengue, Zika, yellow fever, and West Nile virus, pose a substantial and growing threat to public health. The review found that while most cases identified in the literature were travel-related, more than 15% originated in Europe. The overall case fatality rate in the 479 studies reviewed was about 1%. Most of these diseases do not have available treatments or vaccination, which increases the importance of surveillance and prevention policies.
Recent PANSOC postdoc Maria Bekker-Nielsen Dunbar contributed a co-authored chapter during her time with us to the Springer Handbook of Epidemiology on reproducibility in this scientific field.
The authors establish a stepwise framework for epidemiologists to improve reproducibility, which is a topic of increasing interest and relevance in science and metascience. The ten steps discussed cover the entire research process from idea development to paper submission, and in each step the chapter discusses researcher concerns and implementation of the step. The chapter then presents how the use of these steps enhanced the reliability of research using a practical example of epidemiology from the UK.
During her time at PANSOC, postdoc Maria Bekker-Nielsen Dunbar published an article in the Proceedings of the Computational Humanities Research Conference providing an explanation of the use of the term “influenza” in English, in contrast to the more common “grippe” of other Indo-European languages.
While most Indo-European languages refer to the disease using some variant of “grippe”, Italian, English, Uralic, and Nordic languages have preferred “influenza” (which has an Italian origin). The authors argue that “influenza” in contrast to “grippe”, sounds sufficiently different from other English words to avoid ambiguity in understanding. They test the linguistic space available for possible terms that could be used to describe influenza and posit that the term selected provided less ambiguity than the terms used in other Indo-European languages.
This study aimed to explore the reasons adults in the general population, influenza risk groups (RGs) and health care workers (HCWs) in Norway give for their vaccination choices and whether these reasons vary between groups or over time in order to further improve influenza vaccination coverage.
Methods:
Respondents of a nationally representative telephone survey conducted by Statistics Norway were asked “What was the most important reason why you did/did not get vaccinated?”. The question on influenza non-vaccination was included in 2016 and in 2020 to 2023 and the question on influenza vaccination in 2021 to 2023.
Results:
The study included 9 705 individuals aged 18–79 years. Influenza vaccination coverage in the RGs increased from 20.6% in 2016 to 63.1% in 2022, before a reduction to 58.3% in 2023. Common reasons for non-vaccination were similar in all groups. The most cited reasons were “no need” for the vaccine and “no specific reason”, followed by “not recommended/offered the vaccine”, “worry about side effects” and “vaccine refusal”. The most frequent reasons for vaccination among the general population and RGs were protection against influenza and belonging to a RG, while the most frequent responses among HCWs were being offered the vaccine at work/work in health care, followed by a desire for protection against influenza. Receiving a vaccine recommendation from a health professional was mentioned in all groups. We also observed that the proportion reporting “no need” for the vaccine decreased over time, especially among HCWs, and that the proportions reporting vaccine refusal and worry about side effects as reasons for non-vaccination were temporarily reduced during the COVID-19 pandemic.
Conclusions:
The general population and RGs cite protection against influenza as their primary incentive for vaccination, while HCWs mainly refer to their professional role or workplace vaccination. For non-vaccination we see a similar pattern in all groups, with “no need” and “no specific reason” as the main reasons. Of note, worry about side effects and vaccine refusal is as frequent among HCWs as in other groups. Continued efforts to maintain and increase vaccine confidence are needed.
Current literature presents mixed effects of the COVID-19 pandemic on Indigenous communities. We aim to highlight potential disparities and temporal shifts in both the impact of COVID-19 and vaccine uptake among hospitalized Indigenous populations in Chile.
Methods
We conducted an observational analysis utilizing 1,598,492 hospitalization records from 2020 to 2021 based on publicly accessible hospital discharge data spanning 65 healthcare facilities of medium and high complexity funded through the Diagnosis-Related Groups (DRG) mechanism in Chile, representing roughly 70% of the country’s total hospitalizations. This was supplemented with publicly available municipal data on COVID-19 vaccinations and socio-demographic variables. We performed logistic regression analysis at 0.05 level of significance to assess the bivariate and multivariable association of Indigenous status with COVID-19 diagnosis and COVID-19 deaths among hospitalized populations. We also performed univariate and multiple linear regression to assess the association of COVID-19 vaccination rate and Indigenous status at the municipality level. In addition, we report the distribution of top 10 secondary diagnoses among hospitalized COVID-19 cases and deaths separately for Indigenous and non-Indigenous populations.
Results
Indigenous populations displayed lower adjusted odds for both COVID-19 diagnosis (OR: 0.76, 95% CI: 0.74, 0.77) and death (OR: 0.91, 95% CI: 0.85, 0.97) when compared to non-Indigenous groups. Notably, the adjusted odds ratio for COVID-19 diagnosis in Indigenous populations rose from 0.59 (95% CI: 0.57, 0.61) in 2020 to 1.17 (95% CI: 1.13, 1.21) in 2021. Factors such as the significantly higher median age and greater number of comorbidities in the non-Indigenous hospitalized groups could account for their increased odds of COVID-19 diagnosis and mortality. Additionally, our data indicates a significantly negative adjusted association between COVID-19 vaccination rates and the proportion of Indigenous individuals.
Conclusion
Although Indigenous populations initially showed lower odds of COVID-19 diagnosis and mortality, a marked rise in diagnosis odds among these groups in 2021 underscores the urgency of targeted interventions. The observed negative association between the proportion of Indigenous populations and vaccination rates further underscores the necessity to tackle vaccine access barriers and work towards equitable distribution.
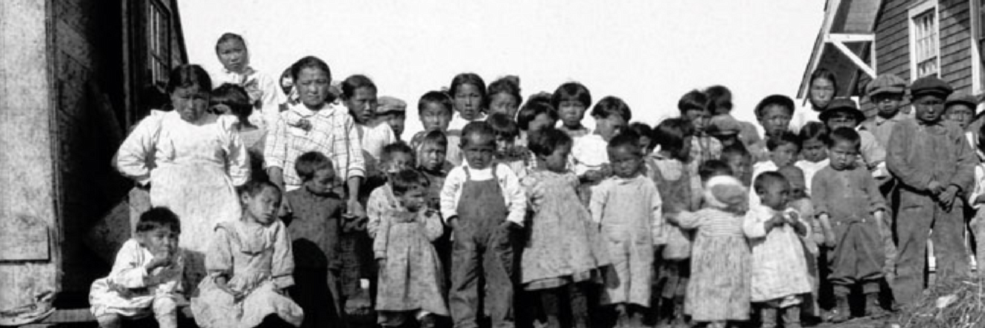
Abstract: The 1918-20 influenza pandemic devastated Alaska’s Indigenous populations. We report on quantitative analyses of pandemic deaths due to pneumonia and influenza (P&I) using information from Alaska death certificates dating between 1915 and 1921 (n=7,147). Goals include a reassessment of pandemic death numbers, analysis of P&I deaths beyond 1919, estimates of excess mortality patterns overall and by age using intercensal population estimates based on Alaska’s demographic history, and comparisons between Alaska Native (AN) and non-AN residents. Results indicate that ANs experienced 83% of all P&I deaths and 87% of all-cause excess deaths during the pandemic. AN mortality was 8.1 times higher than non-AN mortality. Analyses also uncovered previously unknown mortality peaks in 1920. Both subpopulations showed characteristically high mortality of young adults, possibly due to imprinting with the 1889-90 pandemic virus, but their age-specific mortality patterns were different: non-AN mortality declined after age 25-29 and stayed relatively low for the elderly, while AN mortality increased after age 25-29, peaked at age 40-44, and remained high up to age 64. This suggests a relative lack of exposure to H1-type viruses pre-1889 among AN persons. In contrast, non-AN persons, often temporary residents, may have gained immunity before moving to Alaska.
Responses to the letters on “Mortality in Norway and Sweden during the COVID-19 pandemic 2020 – 22: A comparative study.” in Journal of Infection and Public Health.
In Alaska, the 1918–20 influenza pandemic was devastating, with mortality rates up to 90% of the population, while in other arctic regions in northern Sweden and Norway mortality was considerably lower. We investigated the timing and age-patterns in excess mortality in Greenland during the period 1918–21 and compare these to other epidemics and the 1889–92 pandemic. We accessed the Greenlandic National Archives and transcribed all deaths from 1880 to 1921 by age, geography, and cause of death. We estimated monthly excess mortality and studied the spatial-temporal patterns of the pandemics and compared them to other mortality crises in the 40-year period. The 1918–21 influenza pandemic arrived in Greenland in the summer of 1919, one year delayed due to ship traffic interruptions during the winter months. We found that 5.2% of the Greenland population died of the pandemic with substantial variability between counties (range, 0.1% to 11%). We did not see the typical pandemic age-pattern of high young-adult mortality, possibly due to high baseline mortality in this age-group or remoteness. However, despite substantial mortality, the mortality impact was not standing out relative to other mortality crises, or of similar devastation reported in Alaskan populations.